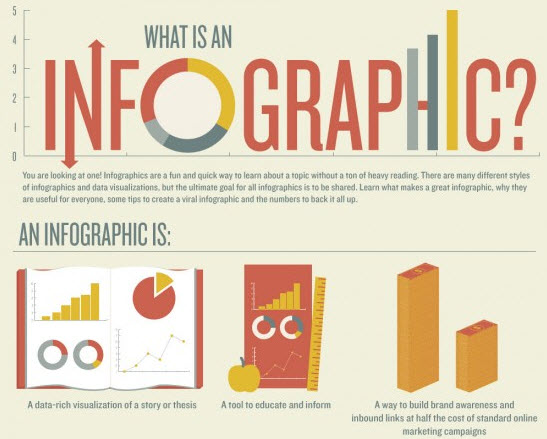
Last week’s blog post covered the use of photos in projects, such as websites or blogs. Now I’d like to introduce you to another type of visual media that can help make your project more engaging: infographics. Infographics, like photos, help draw in readers by presenting information in a visually appealing manner. Infographics are almost like pieces of art; a truly creative piece will attract positive attention. So if you have a lot of data or research to present to your readers, an infographic might be the way to go. After all, reading through chunks of numbers and statistics can be quite dreary. Infographics will help keep your readers engaged and make your information more accessible.
Whether you or a graphic designer will be producing your final infographic, there are some steps you can take and questions to ask in order to maximize your infographic’s success.
- Brainstorm Purpose: Why are you creating this infographic? Who is your target audience? How much data do you have, and how much do you want to include? Are you persuading or informing? Are there any central design elements or a theme you would like to include?
- Data Visualization: What sort of data visualization techniques will you use? Diagrams are good for showing chronological changes or relationships. Maps are good for showing locations or comparing geography of data. Charts are good for showing changes over time and organizational processes. Tables are good for showing direct relationships over a large data set.
- Design: In choosing design elements, decide how much text vs. data visualization you want on your infographic. Choose a set of fonts and a color scheme to keep your infographic consistent. Play around with organization of information. Look at other infographics to get a sense of what you might want in your own infographic. A good place to start is Dailygraphic.com. It’s a great website with new infographics on a range of topics published every day. Remember, infographics may have to go through several iterations before they look perfect! Don’t be afraid to scrap designs in order to achieve your final vision.
Finally, remember that your infographic has a purpose. It should have beginning, middle and end in order to illustrate a point. Your data should also be reliable; double check your sources before creating your infographic in order to boost its credibility! If used properly, a well-designed infographic can be a serious boost to your website. So don’t be afraid to get creative with your data. Engage and educate readers with a visually appealing infographic (and a few pictures too!).